Export beautiful graphics #18858
Comments
|
Just to be sure? |
|
Yes, exactly. I meant the matomo UI.
28.02.2022 10:11:41 Lukas Winkler ***@***.***>:
… Just to be sure?
Are you referring to the plots in the Matomo UI or the ones in the E-Mail report?
—
Reply to this email directly, view it on GitHub[#18858 (comment)], or unsubscribe[https://github.com/notifications/unsubscribe-auth/AS7HARNWEGC46VQR5IGLEGLU5M34XANCNFSM5PQNFIDQ].
Triage notifications on the go with GitHub Mobile for iOS[https://apps.apple.com/app/apple-store/id1477376905?ct=notification-email&mt=8&pt=524675] or Android[https://play.google.com/store/apps/details?id=com.github.android&referrer=utm_campaign%3Dnotification-email%26utm_medium%3Demail%26utm_source%3Dgithub].
You are receiving this because you authored the thread. [data:image/png;base64,iVBORw0KGgoAAAANSUhEUgAAAEgAAABICAYAAABV7bNHAAAAAXNSR0IArs4c6QAAAARzQklUCAgICHwIZIgAAAArSURBVHic7cEBDQAAAMKg909tDjegAAAAAAAAAAAAAAAAAAAAAAAAAAA+DFFIAAEctgHwAAAAAElFTkSuQmCC###24x24:true###][Verfolgungsbild][https://github.com/notifications/beacon/AS7HARPBHOWN2FMF4WV2KYTU5M34XA5CNFSM5PQNFID2YY3PNVWWK3TUL52HS4DFVREXG43VMVBW63LNMVXHJKTDN5WW2ZLOORPWSZGOH3JWPZY.gif]
|
|
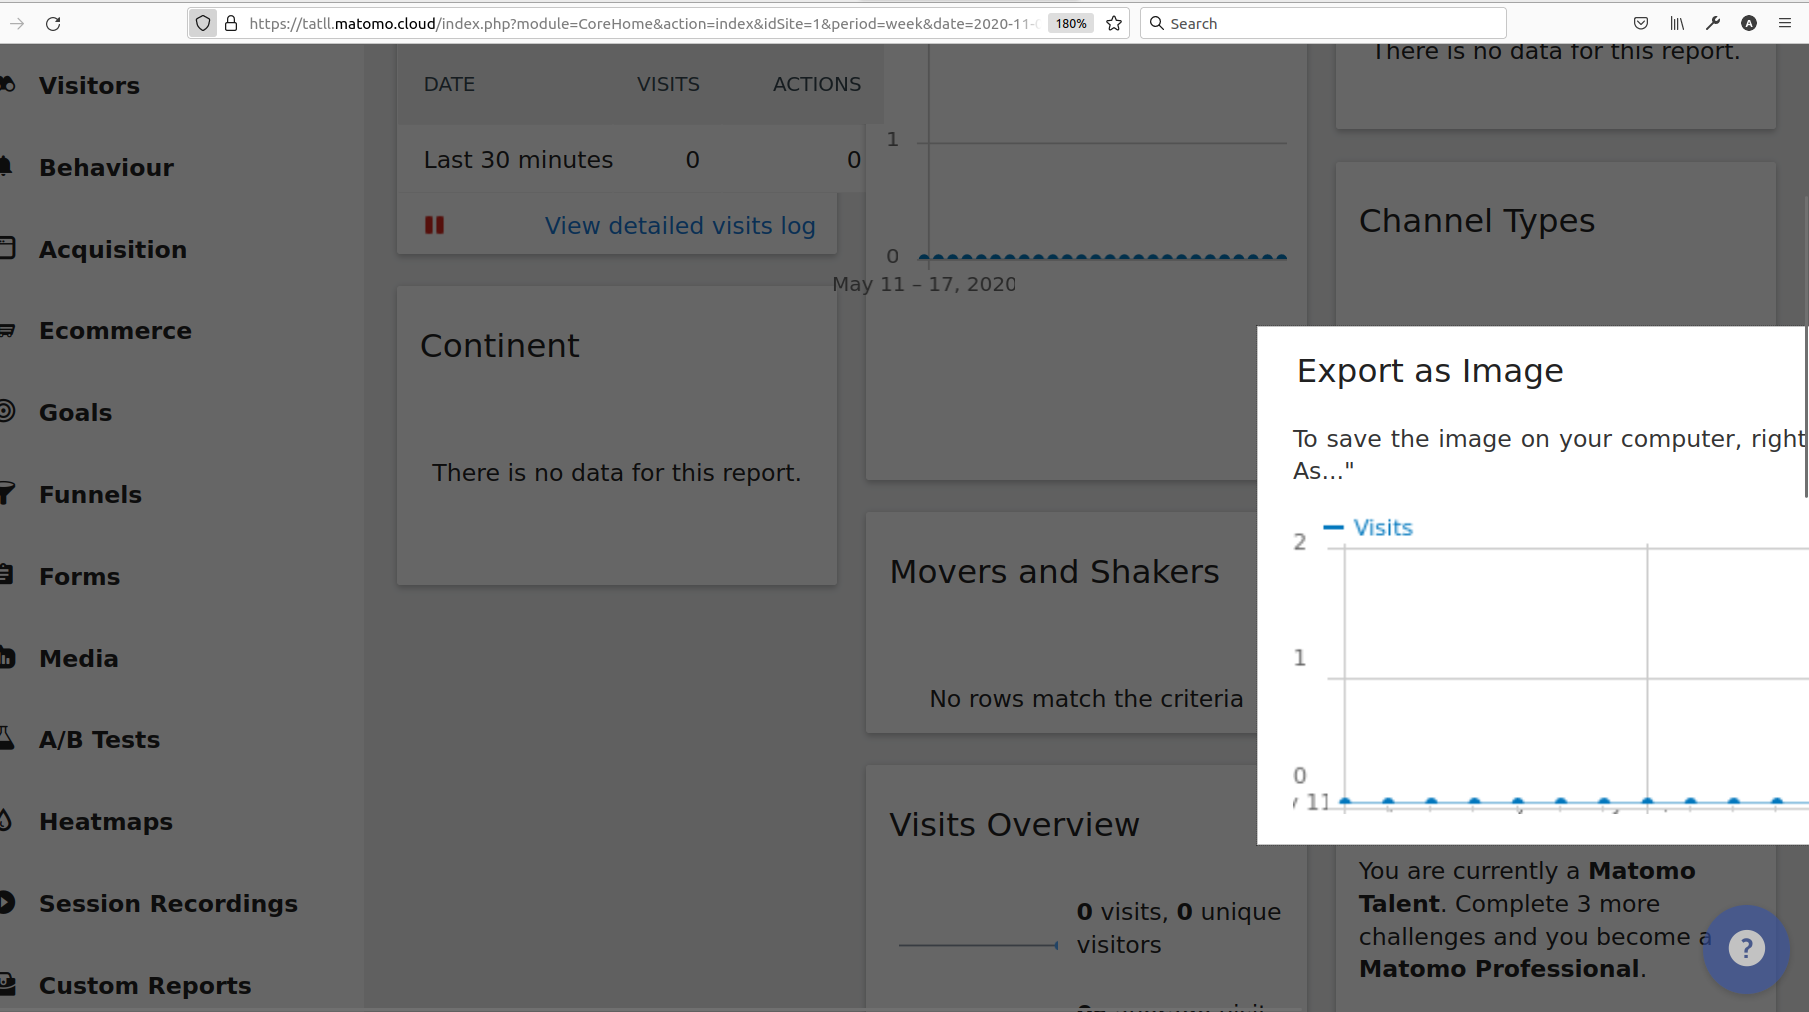
Problem: When a user clicks on the Export as Image, a div that is maybe 300px x 90px appears sometimes (see below screenshot). It's really tiny. And it doesn't stretch well when copy/pasted. Solution: Render that image as nearly full screen, in the HTML or CSS can we just say something like
Right now, users are copying this 300px image and pasting it and stretching the low resolution image. Maybe this could be a very quick remedy, while we wait for the #4969 issue of a new visualization library? |

|
@atom-box The image is always shown in the size it was displayed before. On the dashboard you can maximize the widget before. That way also the export should be bigger. |
|
Does maximize mean the same as zoom? If I zoom, the modal centers itself on an overflowed container div, I think: Just got another comment on this. A user writes what they would most like to see changed about Matomo: "Possibility of making BEAUTIFUL personalized reports: with or without graphs for EACH table, limit the number of table rows, customize the presentation, the graph instead of the standard 28-page reports!" |
|
Is 18942 |
|
"Beautifull report" doesn't mean "100%". It means i'd like to create a periodical PDF report with a graphic or a simple table for EACH table i want in the report, chose what kind of graphic, define the number of lines in a table report, ... Something a bit more "userfriendly" |
Could we just default to 90% full width? Technically it is easy. Is there any downside though? |
The graphics (this concerns all graphs, pie charts, etc.) should be exportable in a much higher resolution, e.g. as PNG. The current resolution of the graphics is insufficient even for a PowerPoint presentation. The axis labels also need optimization - the subdivisions are often anything but intuitive for both time axes and Y-axes, which makes it difficult to interpret the data and thus communicate the results. Ideally, one should additionally be able to predefine personal color combinations (for the purpose of alignment with a company CI) and preferred aspect ratios (a disproportionately wide graphic often appears in large view).
The text was updated successfully, but these errors were encountered: