Graph of returning visitors doesn't show returning visitors when having the segment pre-configured in config file #17123
Comments
|
@robles-design do you see any data in the reports below this graph and all the other reports? |
|
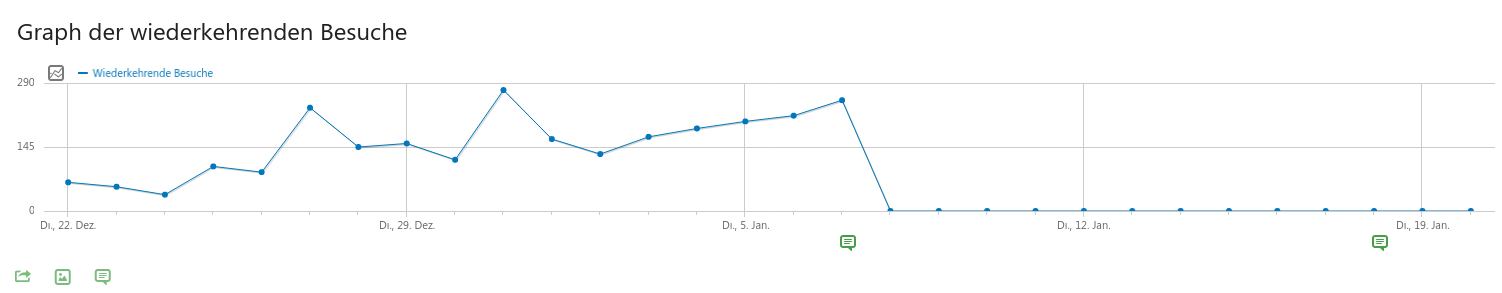
Here is a screenshot of what I see from the 09. January on. The blue line is the returning visitors line.
|

|
@robles-design do you only have this problem for date ranges or also when you select a single day, week or month? |
|
@tsteur same for day and week. Selecting the month there is data, cause there was data until the 8 January (see first screenshot). |
|
@robles-design sorry for all the questions. When you go to "Administration -> General Settings". What does it say for these settings in "archiving settings"?
If you have configured "Archive reports when viewed from the browser: No", I suppose you have a cronjob configured that runs regularly and generates the reports? If that's the case, any chance you can try to execute this manually and see if it shows any error? |

|
@tsteur Yes, you're right. I have a cronjob. No errors after runnig ./console core:archive manually. |
|
@robles-design can you try adding |
|
INFO [2021-01-22 03:00:34] 5940 --------------------------- |
|
@robles-design I guess the output before the summary could be quite useful too. Sorry another question: When you click on |
|
@tsteur Yes, I see data there. Sorry, I can't send you the output before the summary, cause these are client sites. What are you searching for? Maybe I can find it. |
|
i have the same ques. view this in page
|

|
@robles-design is it maybe possible to share the information with some site data removed? Like the name or URL of the sites or if it says the number of visits you could also change that value randomly. We'd ideally have most of the output to fully understand if reports get invalidated and archived etc. |
|
@tsteur do you have an email address for me? |
|
@tsteur I send you a mail. |
|
Thanks @robles-design I suppose above screen you see in idSite=4? Do you also have the same problem in other sites? |
|
@robles-design it be also great to post the output of the system report here which you find in Matomo -> Administration -> System Report. There you can copy the system report and it should be automatically anonymised. |
|
@tsteur yes in all sites as I wrote in the mail. |
|
@tsteur you have another mail. Please search for XXX in the file. Not all data was anonymised. |
|
Hi @robles-design, if there are visits alongside the zero returning visitors metric, then the archive process is probably not at fault. Could you try the following things:
|
|
Hi @diosmosis
Yes
Yes
Yes, it selects visitits. |
|
@robles-design can you run the following sql queries and show the output for both: Replace |
|
@diosmosis I'm not really sure if I did this right with phpMyAdmin, cause I'm not a SQL guy.
Results:
|
|
@robles-design thanks! You ran the SQL correctly. Looks like there is an archive for the returning visits metric, but it has no data (this is the one with idarchive = 74; it's there, but has no Afterwards can you try the following:
|
|
@diosmosis I forgot to run the first SQL query (sorry for that) and started with steps 0–4 with no success. The first time I invalidated the last month via the plugin, because there is no option for a date or date range. The second time I invalidated the date via the CLI. Both times core:archive runs without errors, but no returning visits were shown in the UI. Step 5 Then I remembered a similar case with a self created segment months ago where invalidating didn't work though all commands run without error. The solution was to disable cron in the admin UI, switching to the user UI, click the segments and wondering why it works. After that I switched back to cron and had no problems. Same this time. After these steps the returning visitors are back again :-) I'm back on cron now and will report you if the returning visitors will continue to work. |
|
Having this problem in multiple instances after updating from <=4.5.0 to >=4.6.1 (all of these are "older" instances that also have been updated from 3.x to 4.x):
|

|
Hey @sgiehl ! These instances are all running on Cron archiving with Browser archiving disabled (and most of them also with browser_archiving_disabled_enforce = 1) |
|
Just wanted to add I couldn't reproduce it on one of our instances (browser archiving disabled, also for segments). Worked for "All Visits" on all our instances and when choosing a segment. Also seems to work on https://demo.matomo.cloud/ ? |
|
For Segments, it is working, just not for "All Visits". I'll gather some more data that could be useful to reproduce this. |
|
Interesting @peterbo I have a feeling this might be fixed by https://github.com/matomo-org/matomo/pull/18403/files then. Let me know in case there's more to reproduce this |
|
Implemented the change on the 11th, but still no engagement metrics for "All Visits". Segmented engagement metrics are still working normally. |
|
@tsteur - figured it out! In all instances that showed that error, I'm using: to speed up the engagement metrics processing. After commenting this out, the Engagement metrics are coming back. |
|
@peterbo That's interesting. I guess that somehow causes problems with the segments matomo tries to process internally. Actually those segments are defined "escaped" (like |
|
Great find @peterbo and glad it works now! As it's probably not too often the case that this happens I moved it out of the milestone for now. |
|
Thanks for contributing to this issue. As it has been a few months since the last activity and we believe this is likely not an issue anymore, we will now close this. If that's not the case, please do feel free to either reopen this issue or open a new one. We will gladly take a look again! |
I've recognized this a few days after the Update to 4.1.1, but it must have started with the latest beta before the update to 4.1.1 (see screenshot).
Behaviour > Engagement > Returning visitors
The text was updated successfully, but these errors were encountered: