New page performance reports #15736
New page performance reports #15736
Conversation
aa9d658
to
522655d
Compare
|
The reports for page performance are almost ready, but there are some more adjustments needed for the tracking. Currently all the timing data would be sent with the pageview, but that doesn't actually work, as some of the performance timings might not yet be available when the pageview is tracked. Wondering how to solve that best. As sending the page view event after the onload event was finished won't be a usable solution, I currently see two possibilities with sending the timing data later:
@tsteur What would you prefer? Or do you maybe have a different idea? Also maybe you or @mattab have some comments or additional suggestions on the already implemented stuff (see PR description) |
|
@sgiehl which metrics might not be available? |
|
I actually haven't tested that through yet. But to have all metrics available in the timings api we would need to listen to the window.load event and add the tracking with a timeout of 0, so it's done when onload is finished. So depending on how the matomo tracker is included, I would say at least the onload metric won't be available and maybe also DOM Interactive to Complete, as Matomo might be executed within this process. |
We could send them with ping events, or other tracking requests if needed. Could even temporarily store data and track it on the next page view for the previous one should they visit another page but that gets too complicated. I would say we would simply document that in some cases the value wouldn't be recorded if the onload event happened yet and if they don't use the ping event or have other tracking requests. We certainly do not want to cause any extra tracking request just for that information. Something to think about: Would we need to do anything for single page applications that track multiple page views within one page? I suppose only the first page would then get the metrics which be fine for now. Be good to not make this feature too complicated. As for the update: I suppose either a log table or That might be ok as long as we only execute this query should it not be recorded yet. Meaning the tracker would need to make sure to send the metric only once and the server would only issue this query once and only if the action type is not a page view. When the metric is set in the request, and action type is a page view, then it can be recorded as part of the index. We'll need to see what impact this update has on disk I/O later once in production. We may want a feature later to disable recording metrics after the page view was tracked to avoid this update statement and instead if user wants to have these metrics, force them to listen to the onload event for the track page view. |
00c100e
to
a8b0d70
Compare
|
@tsteur ok. changed the tracking accordingly. If the metrics are already available when the pageview is tracked it will be sent with the pageview, otherwise they will be sent with the next tracking request. |
889662f
to
0d992f9
Compare
0d992f9
to
e12b811
Compare
|
should be ready for a first review. Some tests of the submodules are still failing, but the expected system files will only need an update later... |
|
@sgiehl in wonder if we would want an "All tables column visualisation" and then show all page specific performance metrics? In this screen should we explain that some metrics might not be always tracked? and link to an FAQ or so? Ideally we would remove the new performance menu item under Behaviour and instead show below screen as part of Visitors -> Overview (below the visits overview, not as part of the visits overview sparklines)
Haven't looked at code yet otherwise or tested too much but looking good! The row evolution screen is quite cool! |


e82f3b2
to
5962a8a
Compare
|


a8d68b9
to
d94e565
Compare
8116679
to
b88ce44
Compare
|
@tsteur I've updated the PR and all related PRs so it's no longer possible to set the page generation time. Guess this and all related PRs should be ready for a final review... |
|
Cheers team! It's a very good geek improvement but, isn't it a bit tricky report for a target of non-techy editors? Most of all they don’t have any clue about DOM ... 🤔 |
|
fyi @sgiehl there are some conflicts, otherwise looks good |
|
@tassoman thanks for the comment. There are inline helps that explain those metrics for those who don't understand them directly. Also the default reports will only show the page load time, which should be clear to everyone |
5f9028d
to
2f2d3c5
Compare
82c3e53
to
7ca3fa8
Compare
|
Hi and thanks for the new feature. I've searched for "equivalent", "corresponds", "identical" in this issue, looking for what would correspond to the old "avg generation time", no luck. Is there any ? A client would like to be able to compare old 3.0 matomo statistics with newer 4.0 one. |
|
Hi @AnnoyingTechnology that's unfortunately not quite possible unless you maybe built a custom plugin because the previous generation time is basically a combination of several metrics within the page performance. Sorry about that. If needed, instead of a custom plugin you could also connect to our API https://developer.matomo.org/api-reference/reporting-api and fetch the reports and aggregate this number in a script if needed. Fully aware though this might not be an option in this case. @sgiehl do you remember which performance metrics are basically equal to the previous generation time? |
|
Assuming that most people only tracked the time the server needs to generate the page there is no value it could be directly mapped to. |
|
Thanks to both of you for the clarification. In the case of my client, we migrated his applications to new servers, and upgraded the Matomo instance at the same time. Which prevents us from comparing the before/after performance easily. Anyways, the new performance reports are so much better, he can deal with that ! |
Performance data will be tracked for each page view and will contain the following metrics:
How long it takes the response to get to the user’s device. This includes the time it takes for the request to get to the server, the time it takes the server to render a response, and the time until the first byte of that response gets back to the user’s device.
How long it takes the browser to download the response from the server.
How long the browser spends loading the webpage until the user can starting interacting with it.
How long it takes for the browser to load images/videos and execute any Javascript code listening for the DOMContentLoaded event.
How long it takes the browser to execute Javascript code waiting for the window.load event.
Those metrics can be summed up to get the full page load time.
Action reports for at least urls will show the full page load time as new column
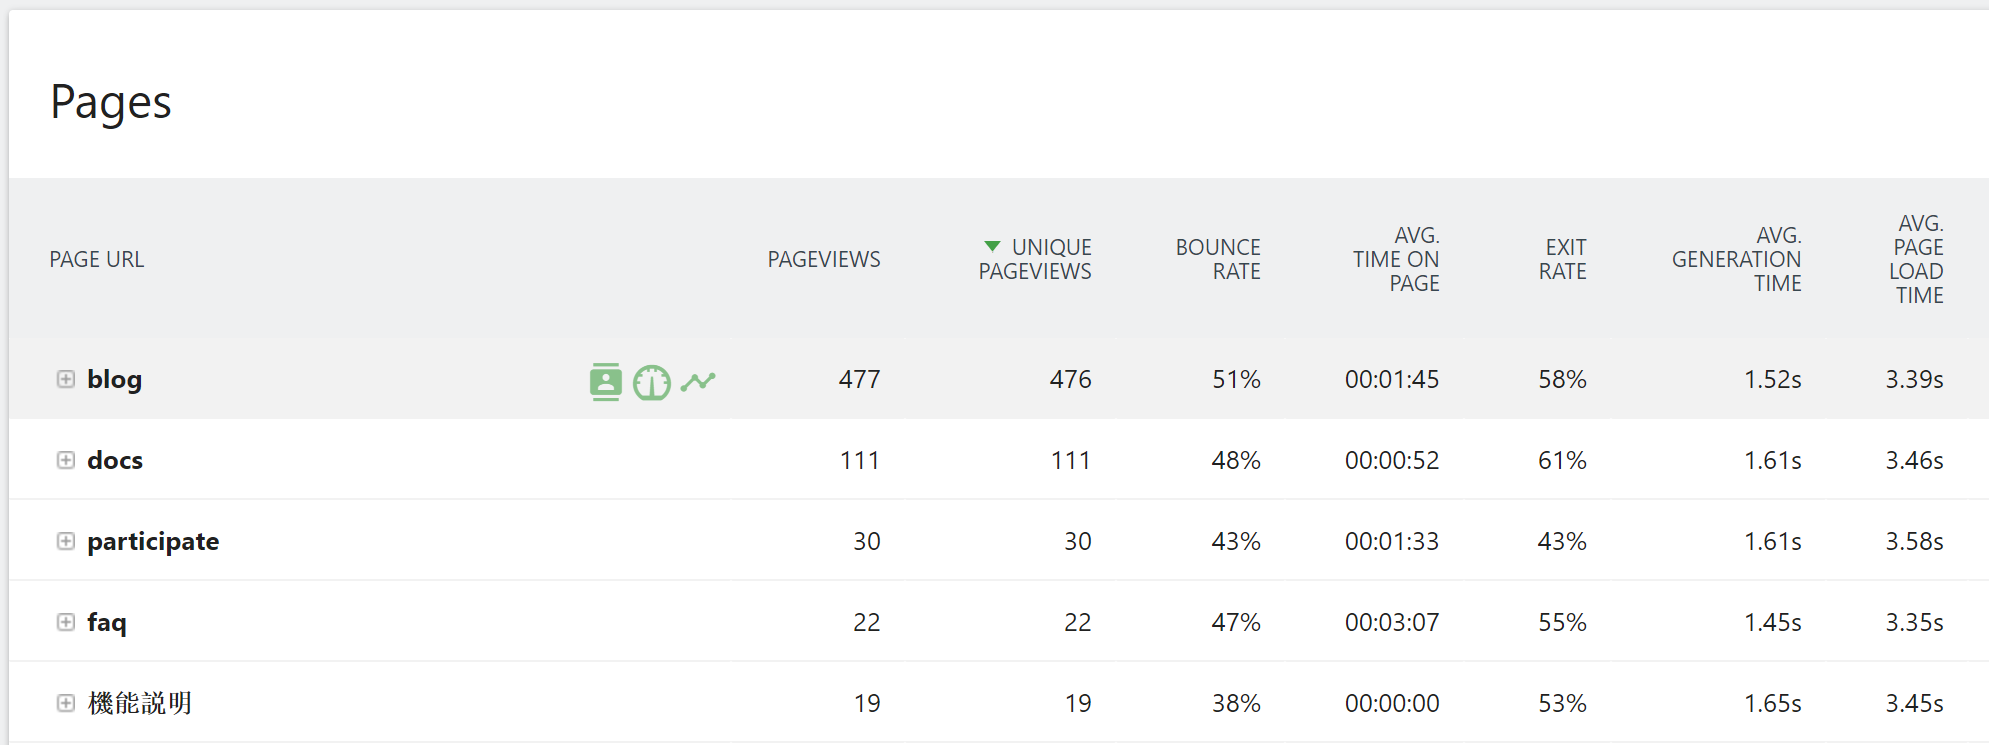
and an additional row action to show the page load evolution:
Also there is a new report page, that shows the overall page load evolution: